
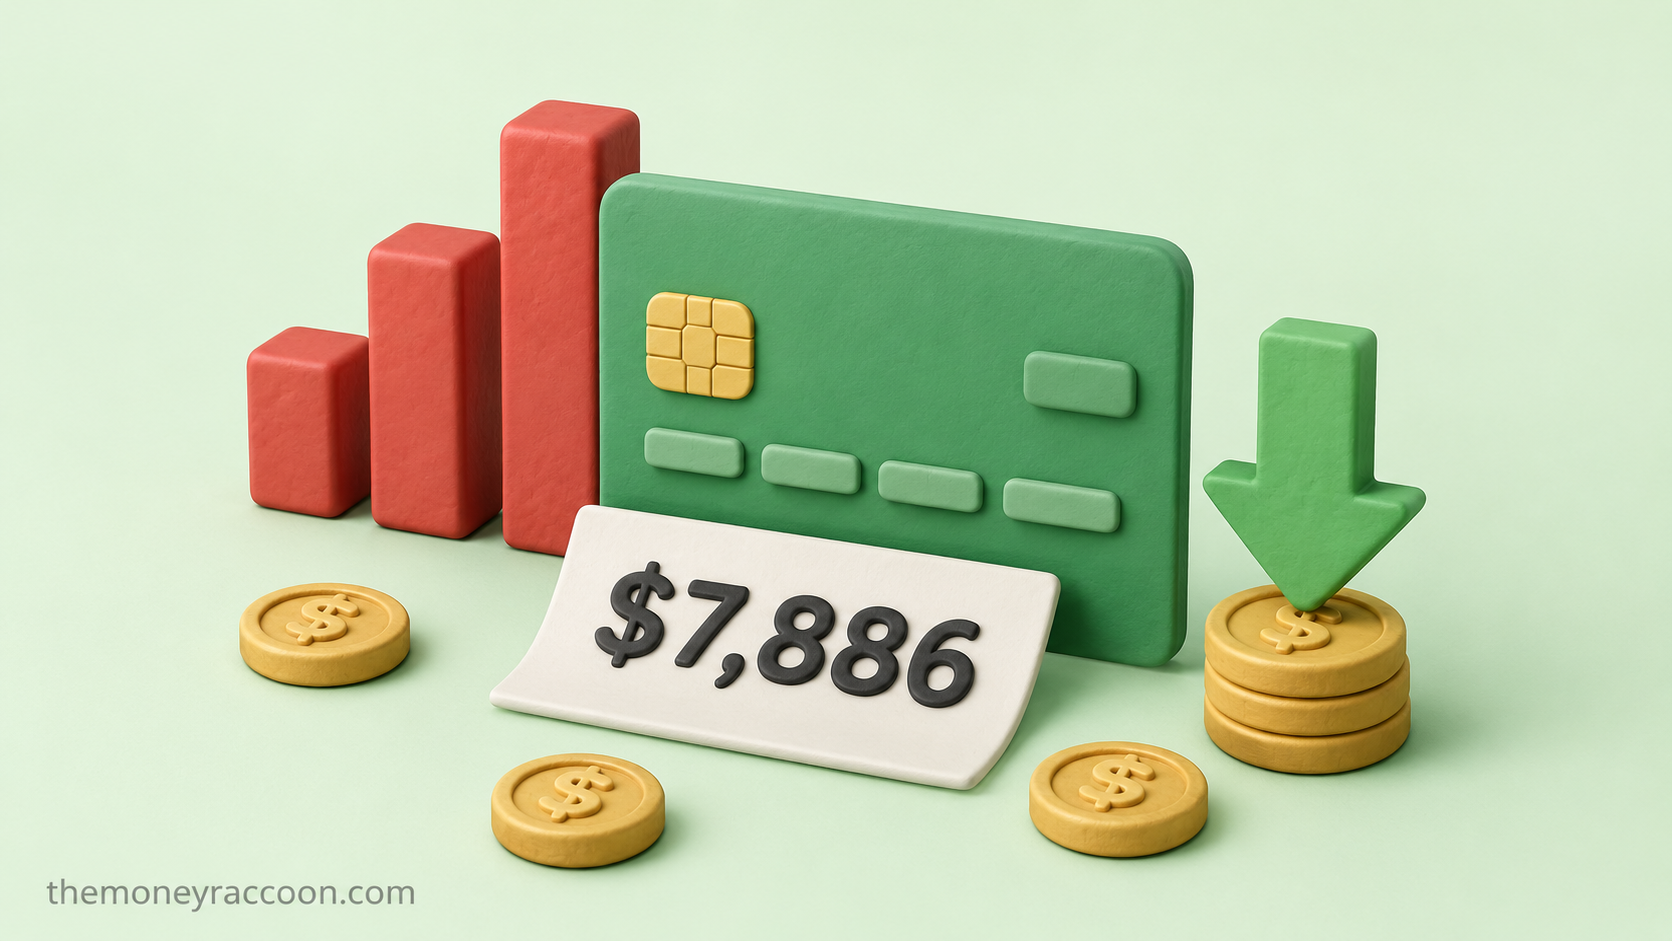
The average credit card debt in America now sits at $7,886 per borrower carrying a balance — and the national total has never been heavier. US household debt hit a record $18.79 trillion in Q1 2026, with credit card balances at $1.25 trillion — up 5.9% from a year earlier and just below the all-time peak set the previous quarter.
Numbers that big go numb fast, so here’s the version that matters at your kitchen table: at today’s average APR of roughly 22%, that $7,886 balance costs about $145 a month in interest alone — money that buys you nothing, moves no balance, and repeats every month you carry it.
The good news hiding in the same report: credit card balances actually fell $25 billion in Q1 2026 and early delinquencies ticked down. Millions of people are paying this debt off right now. Here’s exactly where you stand versus the averages, what the balance really costs, and the five moves that shrink it fastest.
The gist: The average credit card debt is $7,886 per borrower carrying a balance (LendingTree) and about $11,153 per household when spread across all households with balances (WalletHub). Nationally, Americans owe $1.25 trillion on credit cards — near the record high, up 5.9% year over year. At the typical 22% APR, the average balance costs roughly $145/month in interest. Making only minimum payments on it takes decades; a fixed payment plan or a 0% transfer cuts that to 1–3 years.
Average Credit Card Debt: Where You Actually Stand
Different sources report different averages because they measure different groups — here’s the honest breakdown:
| Measure | Amount | What It Means |
|---|---|---|
| Per borrower with a balance | $7,886 | The most relevant number if you carry debt |
| Per household with balances | $11,153 | Households often carry multiple cards |
| Per cardholder (all cardholders) | ~$6,715 | Includes people who pay in full monthly |
| National total | $1.25 trillion | Near record; +5.9% year over year |
| Total household debt (all types) | $18.79 trillion | Record high (Q1 2026) |
| Share of all debt delinquent | 4.8% | Flat quarter over quarter |
Two things to take from that table. First: if you owe less than $7,886, you’re below the average of people carrying balances — the situation is more common and more solvable than it feels at 2 a.m. Second: averages hide the spread. Plenty of households owe $500; plenty owe $30,000. The number that matters is your balance against your payoff plan, not the national scoreboard.
What the Average Credit Card Debt Really Costs You
At the ~22% APR that dominates the market right now, here’s what carrying the average balance does over time:
| Your Approach on $7,886 | Monthly Payment | Time to Payoff | Total Interest |
|---|---|---|---|
| Minimum payments only (~2%) | ~$158 falling | 20+ years | $12,000+ |
| Fixed $250/month | $250 | ~4 years | ~$3,900 |
| Fixed $400/month | $400 | ~2 years | ~$1,900 |
| 0% balance transfer, 18 months | ~$438 | 18 months | ~$240 (transfer fee) |
Estimates at 22% APR; your card’s exact terms govern.
Read the first row twice. Minimum payments are the trap, not the safety net — they’re calculated to keep the balance alive for decades while interest compounds. The jump from row one to row two costs about $92 more per month and saves roughly $8,000 and sixteen years.
That $145/month you’re currently paying in interest? Redirected into savings for the same 20 years, it would be tens of thousands of dollars. That’s the real cost of the average balance: not the $7,886, but everything that money could have been doing instead.
5 Moves to Make If You Carry a Balance
1. Stop paying the minimum — pick a fixed number. Choose a payment you can sustain and keep it fixed even as the balance drops (minimums shrink as you pay, which silently extends your timeline). This single change is worth more than every other tactic combined. Here’s the full 18-month plan applied to a $10,000 balance.
2. Attack in the right order. Multiple cards? Highest APR first saves the most money; smallest balance first builds the most momentum. The math on both methods is here — the best method is the one you’ll still be running in month six.
3. Ask for a lower APR — it works more often than people expect. A five-minute call (“I’ve been a customer X years, I’m considering a transfer, can you lower my rate?”) gets a reduction for a meaningful share of callers. If you’re behind, more is negotiable than you think: the scripts for negotiating credit card debt directly are here.
4. Consider a 0% balance transfer — with a payoff date. Moving the balance to a 0% intro card can save thousands, if you (a) qualify, (b) pay a 3–5% transfer fee, and (c) actually clear it before the promo ends. Divide the balance by the promo months and pay exactly that — automatically. Approval generally needs a decent score, so raising yours first can pay for itself.
5. Freeze the inflow while you drain. Payoff math only works if the balance stops growing. Take the card out of your wallet and your saved browser payments for the payoff period — most people find the “emergency” spending was mostly convenience.
(Educational content, not financial advice — your rates and situation govern.)
Why the Numbers Look Like This in 2026
Three forces explain a $1.25 trillion balance sheet: high APRs (average rates near 22%, a historically punishing level for revolvers), inflation-driven spending on essentials that quietly moved from cash to card, and balance stickiness — once carried, a balance tends to persist because the minimum payment is designed to keep it alive.
But the trend line offers real encouragement: balances dipped $25 billion in the first quarter of 2026, and early delinquency transitions ticked down for credit cards. Aggregate delinquency held at 4.8% rather than climbing. Translation: after several years of rising balances, American households are collectively starting to push back — and the tools they’re using are the unglamorous five above.
FAQ: Average Credit Card Debt
- What is the average credit card debt in 2026? About $7,886 per borrower carrying a balance, and roughly $11,153 per household with balances. Nationally, Americans owe $1.25 trillion on credit cards — up 5.9% year over year and near the all-time high, according to the New York Fed’s Q1 2026 household debt report.
- Is $5,000 in credit card debt a lot? It’s below the average balance of $7,886 among people carrying debt — but “a lot” depends on your income and rate. At 22% APR, $5,000 costs about $92/month in interest alone. Paid at $250/month it clears in roughly two years; at minimums it can drag on for over a decade.
- How much credit card debt does the average American have? It depends on which group you count. Among all cardholders (including people who pay in full each month), it’s about $6,715. Among those actually carrying a balance, it’s $7,886. Per household with balances, about $11,153 — households often carry several cards.
- How long does it take to pay off average credit card debt? Paying only minimums on $7,886 at 22% APR takes over 20 years and costs $12,000+ in interest. A fixed $250/month clears it in about four years; $400/month in about two. Fixing your payment amount instead of following the shrinking minimum is the single biggest lever.
- Is credit card debt going up or down in 2026? Both, depending on the window. Balances are up 5.9% from a year earlier but fell $25 billion in Q1 2026, and early delinquency transitions ticked down. Total household debt across all categories still hit a record $18.79 trillion.
Sources and further reading: Federal Reserve Bank of New York — Household Debt and Credit Report, Q1 2026, CNBC — Credit card debt stands at $1.25 trillion, LendingTree — Credit card debt statistics 2026, WalletHub — Average credit card debt, Advisor Perspectives — Household debt and credit Q1 2026. Payoff figures are our own calculations at 22% APR. Educational content, not financial advice. Last updated: August 2026.

Personal finance writer, founder and editor of The Money Raccoon — 5 years in the industry and 1,000+ articles published in the finance niche. I turn complex money rules — credit scores, debt, banking and investing — into plain-English guides backed by primary sources and real numbers. Every guide here is fact-checked against the institutions that publish the data and updated when the numbers change.