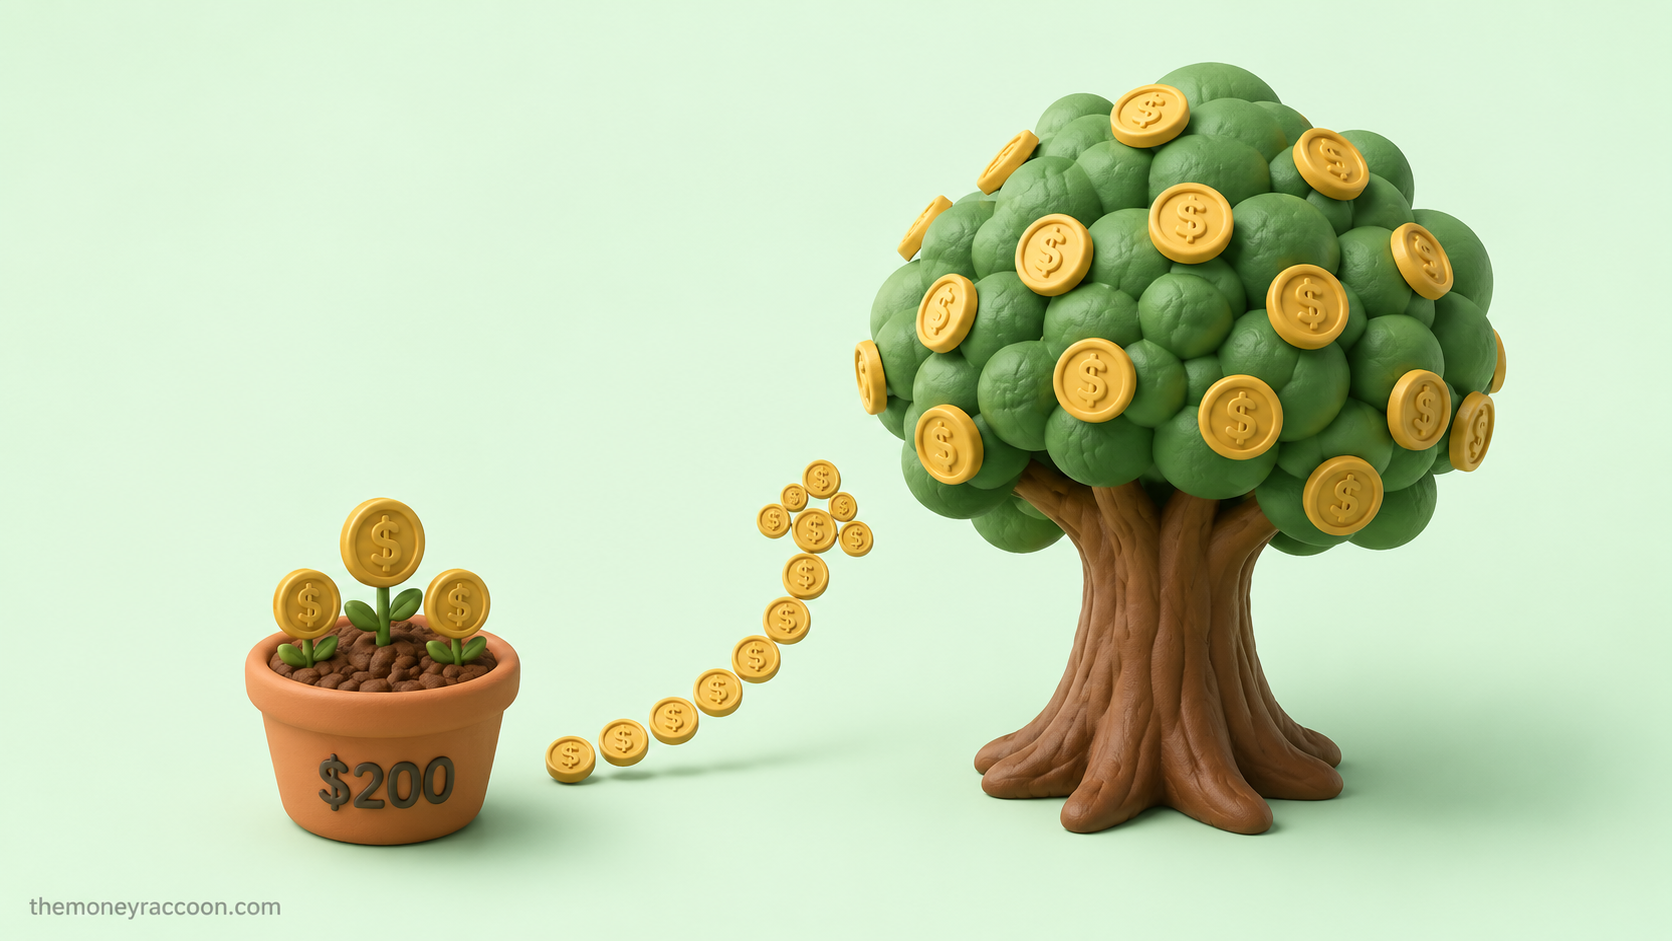
What does 200 a month invested for 20 years actually turn into? Most people guess by multiplying: $200 × 240 months = $48,000, plus “some interest.” Nice, they think. A decent car.
The real answer, at the market’s historical average return: around $152,000. More than triple the deposits. And if the same $200 keeps flowing for 30 years, the pile crosses $450,000 — on total contributions of $72,000.
That gap between the guess and the math is compound growth doing what it always does: working quietly, then suddenly. Below are the full tables — 10, 20 and 30 years, at three honest rates — plus the milestone timeline that shows when the money starts snowballing, the cost of starting late, and the fine print the averages hide.
Short version: $200 a month invested for 20 years grows to roughly $104,000 at a 7% return and $152,000 at the market’s historical ~10% — on just $48,000 of deposits. Stretch it to 30 years and the same habit reaches $244,000–452,000. The formula is boring and undefeated: automatic contributions + broad index funds + time.
The Full Table: 10, 20 and 30 Years
Assumptions kept honest: monthly contributions, returns compounded monthly, and three scenarios — playing it too safe (4%, savings-account territory), the conservative planner’s rate (7%, roughly the market’s long-term inflation-adjusted average), and the S&P 500’s historical nominal average of ~10%.
| 10 Years ($24,000 in) | 20 Years ($48,000 in) | 30 Years ($72,000 in) | |
|---|---|---|---|
| 4% (too safe) | $29,400 | $73,400 | $138,800 |
| 7% (conservative) | $34,600 | $104,200 | $244,000 |
| 10% (historical avg) | $41,000 | $151,900 | $452,100 |
Three things the table teaches better than any lecture:
Time is doing the heavy lifting. At 10%, the second decade earns almost triple what the first one does — and the third decade triples it again. Compounding isn’t a slope; it’s a hockey stick, and the bend rewards whoever started earliest.
The “safe” choice has a price tag. Over 30 years, parking that $200 at savings-account rates instead of market averages costs about $313,000 in forgone growth. Savings accounts are for money that needs to stay reachable; long-horizon money pays rent when it sits there.
The deposits become a footnote. At year 30 (10% scenario), your $72,000 of contributions represent only 16% of the balance. The other 84% is growth — money your money made.
The Milestone Timeline: When the Snowball Starts Rolling
The single most motivating way to look at this plan isn’t the final number — it’s when each milestone falls. At the historical 10%, $200 a month crosses:
| Milestone | Arrives Around | Time Since Last Milestone |
|---|---|---|
| First $10,000 | Year 3.5 | — |
| $25,000 | Year 7 | 3.5 years |
| $50,000 | Year 11 | 4 years |
| $100,000 | Year 16.5 | 5.5 years |
| $200,000 | Year 22.5 | 6 years |
| $300,000 | Year 26 | 3.5 years |
| $450,000 | Year 30 | 4 years |
Read the last column top to bottom: the first $10,000 takes 3.5 years of grinding… and by the end, the account is adding $100,000+ in the same 3.5 years, on the same $200. That’s the hockey stick in slow motion — the early years feel pointless precisely because compounding back-loads its rewards. The people who quit in year 4 quit at the worst possible moment: right after paying compounding’s cover charge, right before the show.
Starting at 25 vs. 35 vs. 45 (the Expensive Decade)
Same $200, same 10% average, same finish line at age 65 — the only variable is the starting age:
| Start Age | Years Investing | Total Deposited | Balance at 65 |
|---|---|---|---|
| 25 | 40 | $96,000 | ~$1,265,000 |
| 35 | 30 | $72,000 | ~$452,000 |
| 45 | 20 | $48,000 | ~$152,000 |
The decade between 25 and 35 costs $24,000 in deposits — and about $813,000 in outcome. No raise, no side hustle, no stock pick will ever buy back a lost decade of compounding. Which leads to the only actionable version of this table: whatever your age, today is the youngest your money will ever be.
200 a Month Invested for 20 Years: What the Averages Hide
Before you screenshot the tables, the honest fine print:
Returns average 10% — they don’t deliver 10% on schedule. Real decades include years like 2008 (S&P 500: −37%) and years like 2019 (+31%); the average only emerges from staying invested through both. The investors who capture the table’s numbers are the ones who didn’t sell in the scary years — behavior, not brilliance, is the performance edge.
Inflation eats part of the pile. $152,000 in 20 years won’t buy what $152,000 buys today. That’s exactly why the 7% row exists — read it as “today’s purchasing power” and the 10% row as the raw number your statement will show. Both are honest; they answer different questions.
Fees compound too, in reverse. The tables assume low-cost index funds (0.02–0.10% expense ratios). Swap in a fund charging 1% and the 30-year balance drops by six figures — same market, same contributions, $100,000+ redirected to the fund manager. Fee-checking is the highest-paid minute in investing.
Taxes depend on the wrapper. Inside a Roth IRA, the year-30 number is all yours. In a regular brokerage, growth gets taxed on the way out. Same $200, same fund — the account type quietly decides who keeps the compounding.
Lump sum vs. monthly, for the curious: if you somehow had the full $48,000 on day one, investing it all immediately would historically beat drip-feeding it. But that’s not the real choice for most people — $200/month isn’t a strategy competing with a lump sum; it’s a strategy competing with not investing. It wins that matchup by six figures.
Don’t Have a Spare $200? Build It
The most common objection to the tables is the budget. Fair — so build the $200 out of money currently leaking:
$50–150/month: one round of bill-negotiation calls — internet, phone, insurance — recovers this much for most households, permanently.
$30–80/month: one honest envelope-budget month usually exposes a leak this size in food delivery or forgotten subscriptions alone.
The remainder: doesn’t need to exist on day one. Start with $50/month and raise it $25 every few months — the tables’ only non-negotiable is that the transfer is automatic. A growing contribution beats a perfect one that never starts.
And when you’re ready to place the first dollar: here’s exactly how to start investing, step by step, with as little as $100 — account type, broker, first fund, all of it.
The Whole Plan in Four Lines
- Open a Roth IRA (or brokerage) at a $0-minimum broker — 10 minutes
- Automatic $200/month (or whatever’s honest) into a broad index fund
- Ignore every crash, headline and hot tip for 20+ years
- Collect the last column of Table 1
It fits on an index card because it’s supposed to. The hard part was never the knowledge — it’s letting the boring machine run without touching it.
FAQ: 200 a Month Invested for 20 Years
How much is 200 a month invested for 20 years at 10 percent? About $151,900 — on total deposits of $48,000. The other ~$104,000 is compound growth. At a more conservative 7%, the same plan reaches roughly $104,200.
What if I invest 200 a month for 30 years instead? The numbers jump dramatically: about $244,000 at 7% and $452,000 at 10% — on $72,000 of deposits. The third decade alone adds more than the first two combined; compounding back-loads its rewards.
Is investing 200 dollars a month enough to retire? Alone, probably not — but it’s a serious foundation. $200/month for 40 years at historical returns crosses $1.2 million. Most people start there and raise contributions as income grows; the habit matters more than the starting amount.
Where should I invest 200 a month as a beginner? The boring, evidence-backed answer: a broad low-cost index fund (S&P 500 or total market) inside a Roth IRA if it’s retirement money, on automatic monthly contributions. That single setup replicates what the tables above assume.
What’s the best age to start investing 200 a month? Whatever age you are today. Starting at 25 instead of 35 roughly triples the age-65 outcome at historical returns — the calendar is the most powerful variable in the entire table, and it only moves in one direction. (Educational content, not financial advice.)
Research and references: Fidelity — S&P 500 average returns, SlickCharts — S&P 500 total returns by year.

Personal finance writer, founder and editor of The Money Raccoon — 5 years in the industry and 1,000+ articles published in the finance niche. I turn complex money rules — credit scores, debt, banking and investing — into plain-English guides backed by primary sources and real numbers. Every guide here is fact-checked against the institutions that publish the data and updated when the numbers change.